Wazuh Custom Dashboard & Attack Statistics

A Wazuh Custom Dashboard is a personalized set of visualizations that you build inside the Wazuh Dashboard to monitor and analyze specific security data that matters to you. Instead of relying only on the default dashboards that come pre-packaged (like PCI DSS, HIPAA, Vulnerability, FIM, etc.), you can design your own dashboard panels, filters, and queries to track your organization’s unique use cases.
Hi, I’m Ismail — CEO of Cyberkarta, one of the fastest-growing cybersecurity companies in Indonesia. If you have ideas, insights, or challenges in cybersecurity that you’d like to explore together, feel free to reach out through the comments or connect with me on LinkedIn. I’d love to hear from you and collaborate on building a safer and more resilient digital ecosystem.
LinkedIn Profile — https://www.linkedin.com/in/ismail-hakim/
Company Website — https://cyberkarta.com
The Benefit
The benefits of a custom dashboard in Wazuh come down to visibility, efficiency, and alignment with your needs. Here are the main advantages:
- Better communication with management — Create high-level KPI dashboards for executives, for example, to show attack trends, risk scores, or vulnerability counts in a simplified view.
- Faster incident response — Tailored panels make it easier to spot anomalies and attacks quickly. For example, a widget showing the top 10 most recent cases of malware infection.
- Adaptability to the environment — Every organization has unique log sources (firewall, EDR, cloud, and applications). Custom dashboards allow integrated and consistent visualization of this data.
Configuring Your First Wazuh Custom Dashboard
Creating dashboards in Wazuh is a simple and practical process once you know where to begin. In this section, we’ll walk through Configuring Your First Wazuh Custom Dashboard, guiding you from the initial screen to a working security view.
[STEP 1] Initial Configuration of Wazuh Dashboard

- To begin with, locate the hamburger menu in the top corner of your dashboard.
- Under the explore sub-menu, select the “Dashboards” option.
- To enrich the data collected in the Wazuh Custom Dashboard, it is recommended to install some sample data.
[STEP 2] Adding Sample Data

- On this page, you can choose different sample datasets to populate your Wazuh Custom Dashboard. For the purpose of this blog, there are no issues with selecting all available sample data.
- If the data is added successfully, an “INSTALLED” label will appear at the top of each box.
[STEP 3] Creating The First Wazuh Custom Dashboard

After all necessary data has been added, you can return to the dashboard creation menu from “STEP 1” and click the “Create new dashboard” button.
[STEP 4] Adding the First Object to Your Wazuh Custom Dashboard

- Initially, your custom dashboard is empty. To start adding object(s), locate the “Create new” button.
- For example, choose a pie object.
- Choose “wazuh-alerts-*” as the data source.
[STEP 5] Configuring Pie Object

- The data can be aggregated based on count, sum, top hit, or unique count. For now, we’ll stick to count-based aggregation. For naming conventions, you can define a custom label for your object.
- For a pie chart object, it is recommended to choose the “Split slices” option. Then, select the field based on the Wazuh Alerts field name.
For example, if you choose “rule.description”, Wazuh will classify and count the alert percentage based on the rule description. Additionally, it is important to decide the size of the pie chart segment. In this example we choose the top 10 most alerts based on the rule description. - After filling in all the required fields, click the “Update” button.
- Don’t forget to “Save” your pie chart object.
[STEP 6] Saving Object

This step involves creating a title and description for the object. Once the object is saved, it will appear on your custom dashboard.
[STEP 7] Optionally, Other Objects can be Added to the Custom Dashboard

In this step, we create a metric object and add it to the custom dashboard. It’s useful to display the total alerts generated by Wazuh on your dashboard, right?
[STEP 8] Defining Time Range
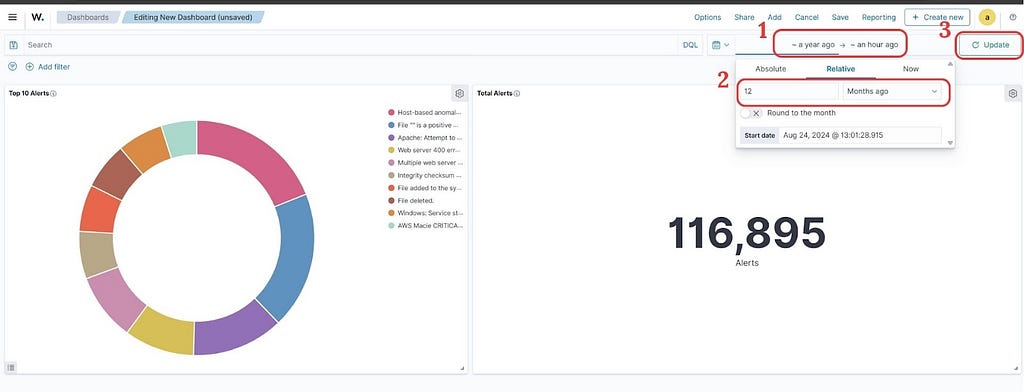
The Wazuh Custom Dashboard is a special feature. You can define a time range, and all metrics on the dashboard will adjust accordingly. Here are the sub-steps to customize the time range:
- Locate the time selection in the top menu bar.
- Choose a time range suitable for your dashboard.
- Update the time range.
[STEP 9] Saving Dashboard and Other Additional Features

To finish all dashboard customization, save your progress by clicking the Save button in the top corner. Additionally, you can create a visual report based on the custom dashboard by clicking the Reporting button.
If you want to create other dashboards, use the Create new menu in the top-right corner.
Closing
By following these steps, you’ve created your first Wazuh Custom Dashboard and learned how to add objects, apply filters, and adjust time ranges. A custom dashboard gives you clear visibility into alerts, compliance, and security trends — tailored to your own needs.
You can continue refining your dashboard with new visualizations, integrate more data sources, and build reports that communicate insights effectively to both technical teams and management. With Wazuh, your dashboard becomes a powerful window into the security posture of your environment.
For more information, you can always refer to the documentation about Wazuh Custom Dashboard https://documentation.wazuh.com/current/user-manual/wazuh-dashboard/creating-custom-dashboards.html.
Wazuh Custom Dashboard & Attack Statistics was originally published in Cyberkarta on Medium, where people are continuing the conversation by highlighting and responding to this story.